While the agility of Rails has never been in doubt, there is often controversy about its performance.
DTrace is a nice dynamic framework to analyze the behavior of your application as the Twitter team proved recently. A new tool in the battle for memory issues is the Rails plugin BleakHouse by Evan Weaver. One of the advantages of a dynamic language like Ruby is its ability to introspect: examining the state of your application from within the application itself. But one has to be careful when using ObjectSpace (the Ruby garbage collected object heap explorer). Indeed, BleakHouse in a first version took advantage of ObjectSpace to take snapshots of Rails application, but Evan Weaver found out ObjectSpace is not quantum: using it changes its own state.
BleakHouse now comes with a leak-free C implementation that directly instruments the heap. The advantage is that it now charts actual memory usage (swap, real, and combined) and it’s faster than before.
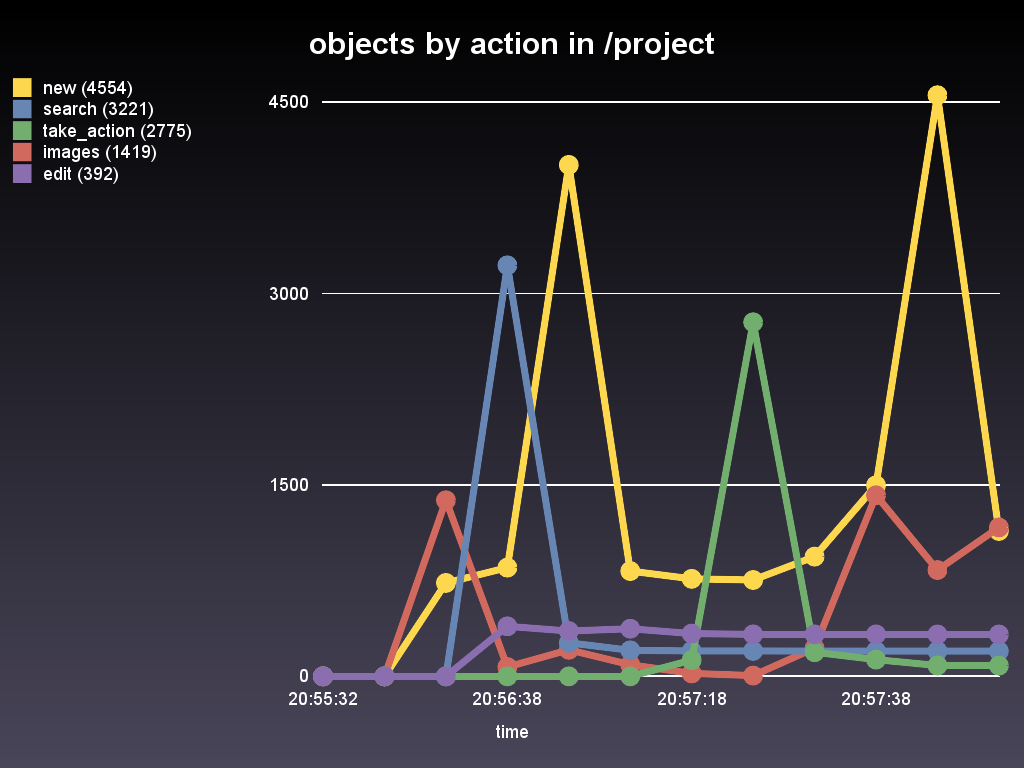
It produces charts of references by controller, by action, and by object class.
Bleakhouse needs gruff (and therefore rmagick). Since it is a C implementation, BleakHouse also needs a patched Ruby binary to monitor your application. Once the plugin installed and your environment set as production, your application will be tracked. At the end, you will run a rake goal to generate the graphs:
 |
 |
 |
Bleakhouse reminds InfoQ of the fifth suggestion from Charles Nutter about making Ruby better: getting rid of ObjectSpace, all the more when at the end one has to patch its vm to do some monitoring.
ObjectSpace harms Ruby by limiting the flexibility of its garbage collecting and threading subsystems, and should be eliminated.
Java has a lot of efficient heap analyser, you could wonder where are all the RProbe, RProfiler for Ruby? I guess with time, new VMs, more companies involved, such tools should arrive...