In a recent blog post, Google announced the general availability of Monitoring Query Language (MQL) in Cloud Monitoring.
MQL provides developers and operators with powerful metric querying, analysis, charting, and alerting capabilities. They can use the language for use cases such as troubleshooting purposes, root cause analysis, reporting and analytics, and complex alert logic.
Google built MQL using operations and functions. Using the 'pipe' idiom, operations are connected together, where one operation's output becomes the input to the next – and by linking, users can build up complex queries incrementally. In the same way, users can compose and chain commands and data via pipes on the Linux command line – allowing them to fetch metrics and apply operations using MQL. Users can use MQL to:
- Create ratio-based charts and alerts
- Perform time-shift analysis
- Apply mathematical, logical, table operations, and other functions to metrics
- Fetch, join, and aggregate over multiple metrics
- Select by arbitrary, rather than predefined, percentile values
- Create new labels to aggregate data by using arbitrary string manipulations, including regular expressions
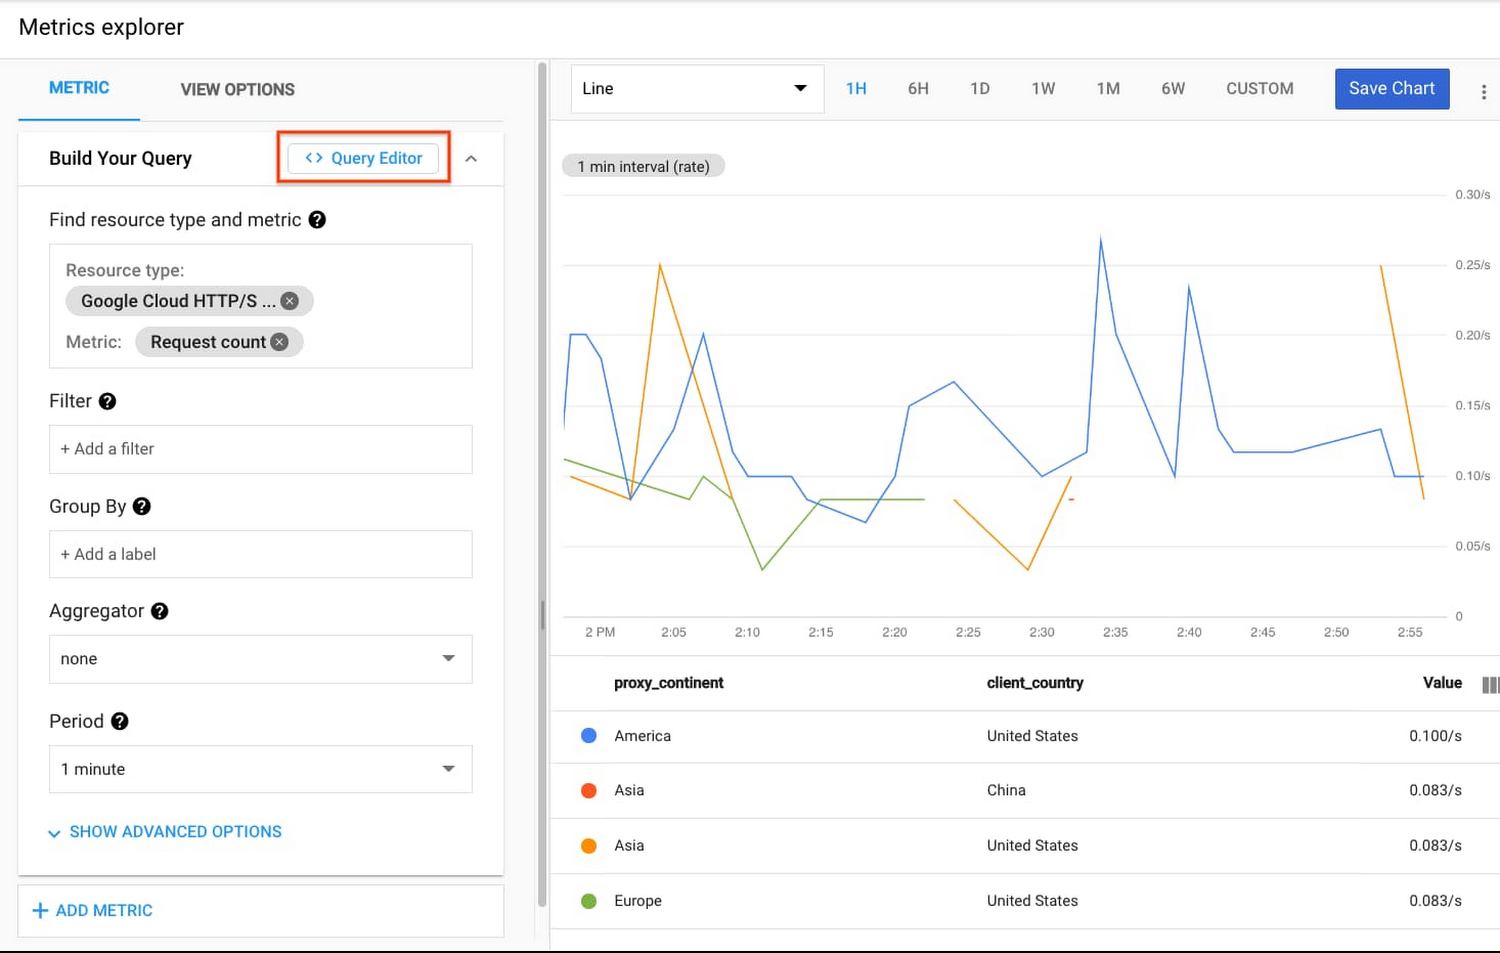
Developers and operators can access the MQL Query Editor through the Cloud Monitoring Metrics Explorer. Next, they can create a query in the Metrics Explorer UI and subsequently, by clicking the Query Editor button, see the query converted to an MQL query.
fetch https_lb_rule::loadbalancing.googleapis.com/https/request_count
| group_by [matched_url_path_rule],
    sum(if(response_code_class = 500, val(), 0)) / sum(val())

Source: https://cloud.google.com/blog/products/management-tools/introducing-monitoring-query-language-or-mql
Another recent feature is that a query can also be used as an alert policy by navigating to Alerting - a developer or operator can create an alert policy by clicking 'Add Condition' and again see the same query editor as in the Metrics Explorer. For a threshold alert, for instance, a developer or operator can use the condition operation.
fetch https_lb_rule::loadbalancing.googleapis.com/https/request_count
| group_by [matched_url_path_rule],
    sum(if(response_code_class = 500, val(), 0)) / sum(val())
| condition val() > .50 '10^2.%'
Similarly, other public cloud providers, such as Microsoft, provide a query language called Kusto Query Language (KQL) for developers and operators. With KQL, they can query Azure Monitor logs. Furthermore, AWS also has a proprietary query language for its CloudWatch monitoring service. All these proprietary languages follow the 'pipe' idiom and use operations and functions.
In the blog post, Rory Petty, cloud monitoring product manager, wrote:
MQL represents a decade of learnings and improvements on Google's internal metric query language. The same language that powers advanced querying for internal Google production users is now available to Google Cloud users as well.
Also, Richard Seroter, director of outbound product management at Google Cloud, said in a tweet:
So much of what we learn running 9 services with 1B users makes its way into GCP for you to take advantage of.
Developers and operators can find more details on MQL in the Cloud Monitoring documentation pages and guidance through the quickstarts, samples, and reference guide.