Recently AWS announced the general availability (GA) of Amazon Managed Service for Prometheus (AMP), a Prometheus-compatible monitoring service for container infrastructure and application metrics for containers.
During re:Invent 2020, the company introduced the preview of Amazon Managed Service for Prometheus and Amazon Managed Service for Grafana. Now Amazon Managed Service for Prometheus is GA and includes new features such as alert manager and ruler that support Amazon Simple Notification Service (Amazon SNS) as a receiver destination for notifications from Alert Manager.
With AMP, customers can use the Prometheus query language (PromQL) to monitor the performance of containerized workloads without managing the underlying infrastructure required to scale and secure the ingestion, storage, alert, and querying of operational metrics. The ingestion can be from over 150 Prometheus exporters. Furthermore, customers can collect Prometheus metrics from Amazon Elastic Compute Cloud (Amazon EC2), Amazon Elastic Container Service (Amazon ECS), and Amazon Elastic Kubernetes Service (Amazon EKS) environments using AWS Distro for OpenTelemetry (ADOT) or Prometheus servers as collection agents.
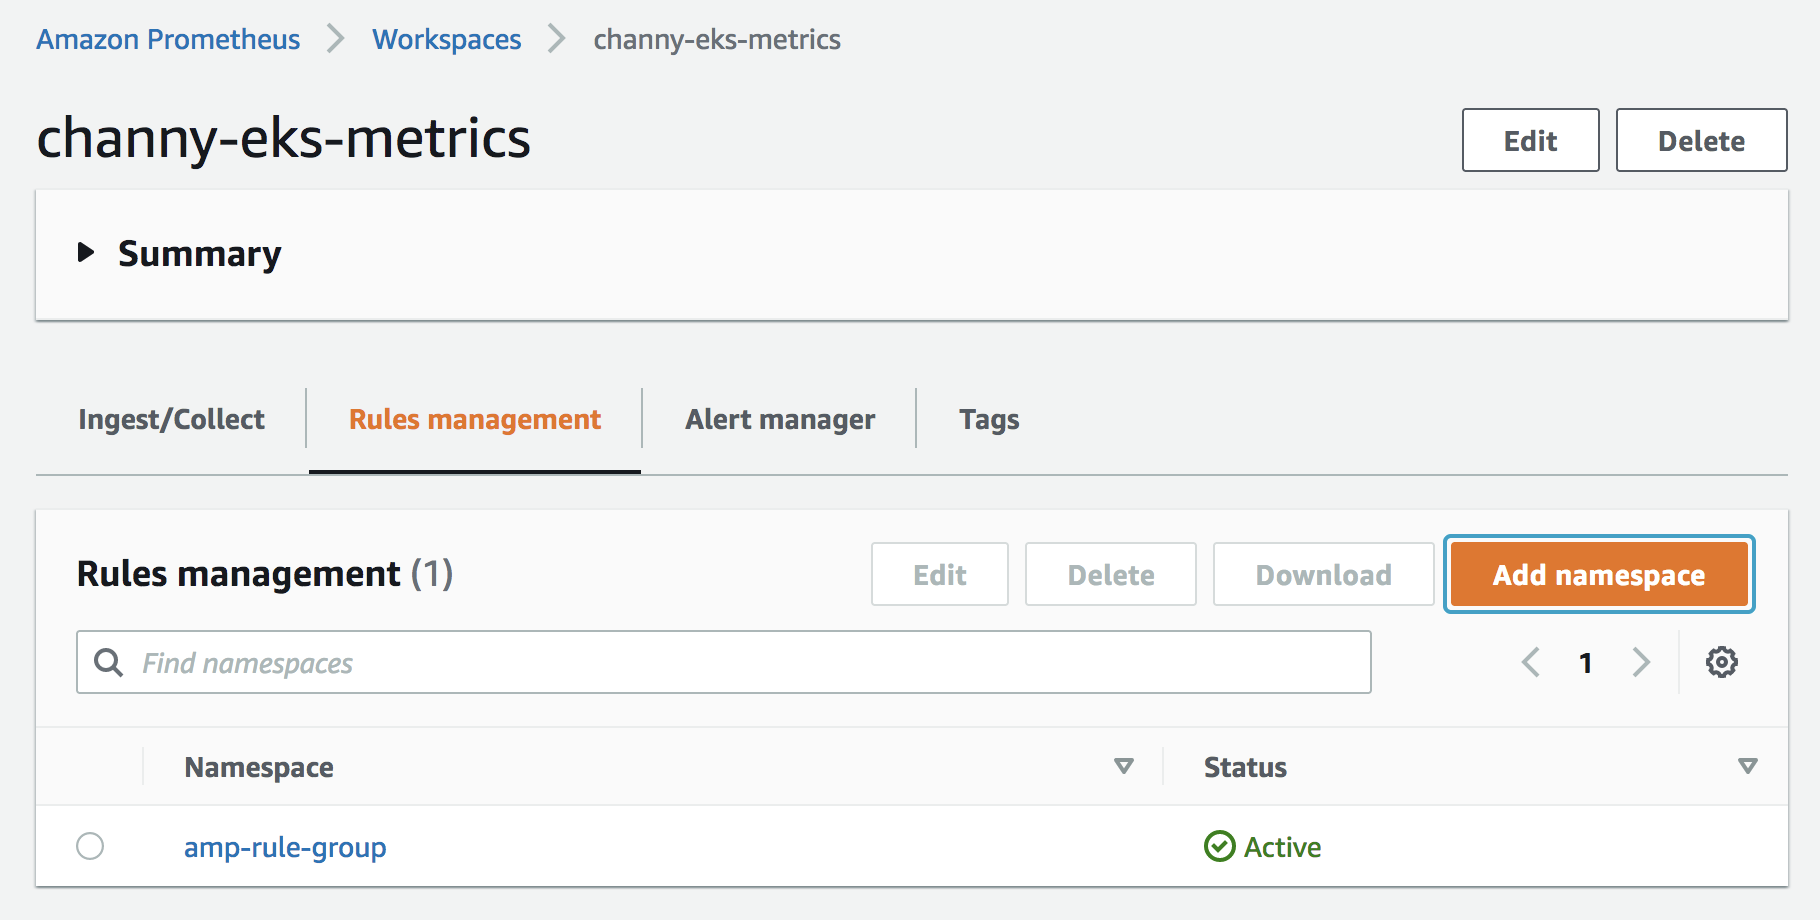
The added alert manager and ruler features are available when creating a so-called workspace - a logical space dedicated to storing, alerting, and querying metrics from one or more Prometheus servers. Users can set up the ingestion of Prometheus metrics to the created workspace using Helm and query those metrics, and subsequently, select a namespace in the rules management and select a YAML file containing recording rules and alerting rules.
The next step involves defining alerts on the rules, setting a destination of the alerts to an Amazon SNS topic, and configuring the alert manager. As Yanny Chun, a principal developer advocate for AWS, explains in an AWS News blog post the GA release:
The alert manager routes the alerts to SNS and SNS routes to downstream locations. Configured alerting rules will fire alerts to the Alert Manager, which deduplicate, group, and route alerts to Amazon SNS via the SNS receiver. If you’d like to receive email notifications for your alerts, configure an email subscription for the SNS topic you had.
Furthermore, an AWS Management & Governance blog post explains that the alerts indirectly can be hooked up to PagerDuty. The authors conclude:
The combination of the Amazon Managed Service for Prometheus Alert Manager, an SNS topic, and a subscribed Lambda function demonstrated how to send alerts from Amazon Managed Service for Prometheus to PagerDuty. This pattern is especially helpful for organizations to migrate their existing OSS Alert Manager configurations to Amazon Managed Service for Prometheus Alert Manager.

Currently, Amazon Managed Service for Prometheus is available in the US East (N. Virginia), US East (Ohio), US West (Oregon), Europe (Frankfurt), Europe (Ireland), Europe (Stockholm), Asia Pacific (Singapore), Asia Pacific (Sydney), and Asia Pacific (Tokyo) AWS Regions. Pricing is based on metrics ingested, queried, and stored – more details are available on the pricing page.
