Grafana, an open-source graphing tool, has reached its version 9 release. The key goals behind version 9 are improving the user experience, making observability and data visualization easy and accessible, and improving alerting.
Visual query builders make their debut in Grafana 9, providing easier and more intuitive ways to discover and investigate data. These are for Prometheus, widely-adopted alerting and monitoring tool, and for Grafana Loki, Grafana's own answer for log aggregation. A new dashboard panel also provides high-resolution histogram visualizations.
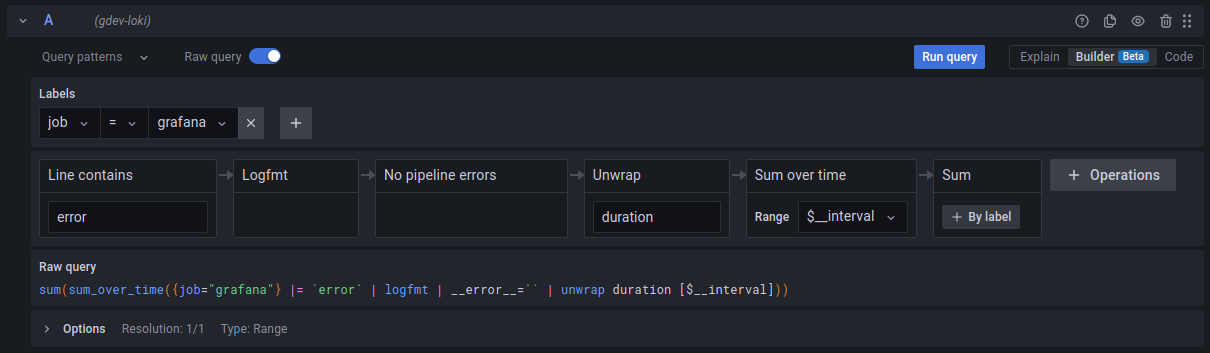
Previously, the only option for building queries in Grafana was through writing PromQL, which comes with a steep learning curve to write and understand, and this can be a daunting task for new users. The new visual query builder allows anyone to build queries with a visual interface, by choosing metrics through a searchable dropdown menu. This acts on both metrics and labels for maximum ease of use. The interface also allows a developer to switch between the builder and code modes without losing their changes.
Furthermore, an explore-to-dashboard workflow allows users to create dashboards directly from the "Explore" mode. This means that it's now possible to create a desired view and save it as a dashboard without copy-and-pasting the query into the dashboard creation mode - removing much scope for errors.
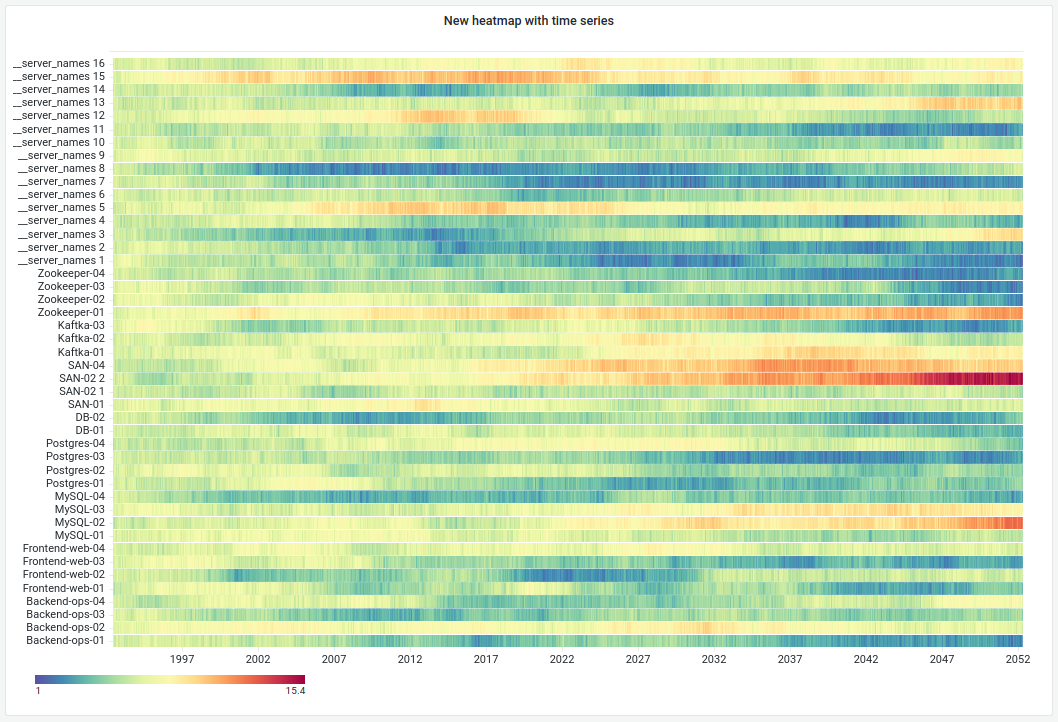
Heatmap panel performance has been improved, and granular control over color palettes has been added to improve visualisation of data.
A command palette has been added - boosting productivity for those who prefer to work with the keyboard through easier key-based navigation and search.
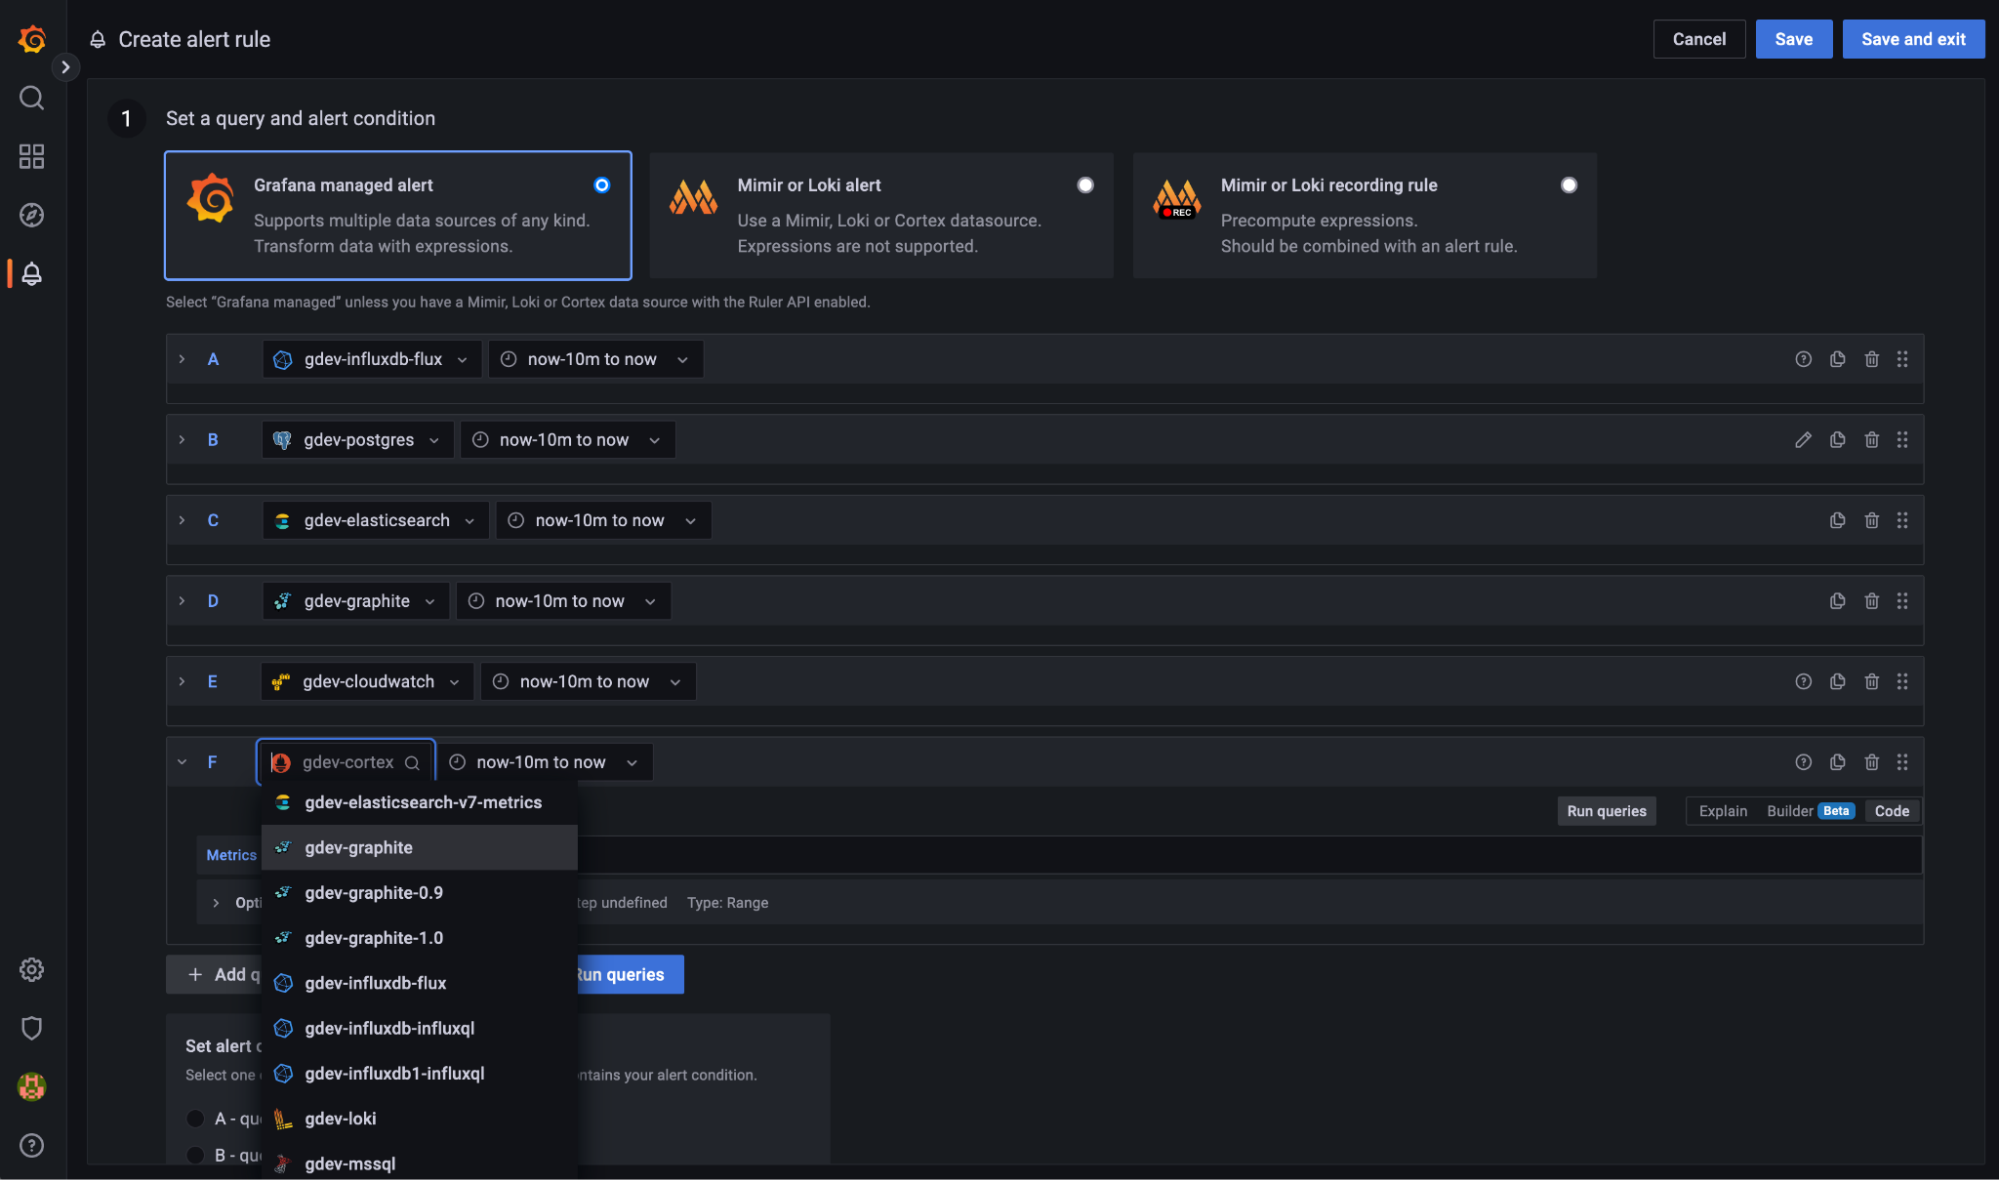
Changes to the alerting experience, trialed as an option in earlier versions of Grafana, have now been made the default, leading to several improvements:
- Alerts are now streamlined and simplified across multiple data sources and Grafana deployments.
- Alerts are now available based on a single rule, regardless of whether they are tied to a specific panel or dashboard. This removes a limitation that was previously in place.
- Alerts can now be multi-dimensional - so a single alert can be triggered by more than one item triggering the rule.
- Grouping and routing of alerts are also improved, with notification policies allowing admins to bundle alerts together - preventing a potential storm of notifications when multiple alerts fire.
- Granular alert muting and silencing are also now possible, allowing admins to prevent notifications at certain times (such as weekends), and to turn off notifications for an already existent alert temporarily.
Finally, the Enterprise versions of Grafana come with further improvements. Reporting is improved with it now possible to add multiple dashboards to a single report and embed a static image from a dashboard in a report. Enterprise version 9.0 also contains enhancements to envelope encryption and to RBAC (role-based access control).
Grafana 9.0 is now available.